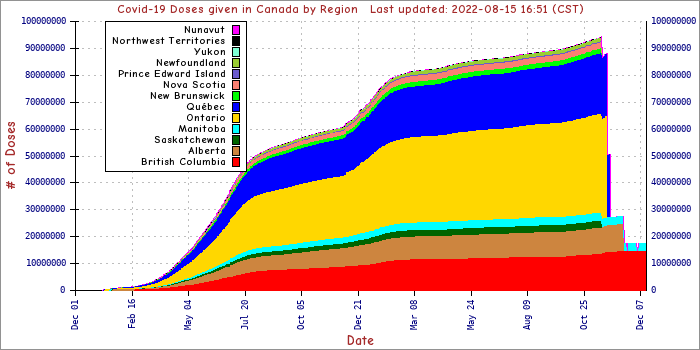
Graphs of Covid-19 Vaccination in Canada
Graphs dynamically generated at https://www.probo.org/covid/canada
are all available on this page for your convenience.
| National Profiles |
|---|
| |
 |
 |
|
|---|
| Vaccine Distribution in Canada |
|---|
| |
 |
 |
|
|---|
| Regional Vaccination Profiles |
|---|
| Region | By raw numbers | As percent of the regions's population |
|---|
| British Columbia |
 |
 |
| Alberta |
 |
 |
| Saskatchewan |
 |
 |
| Manitoba |
 |
 |
| Ontario |
 |
 |
| Québec |
 |
 |
| New Brunswick |
 |
 |
| Nova Scotia |
 |
 |
| Prince Edward Island |
 |
 |
| Newfoundland |
 |
 |
| Yukon |
 |
 |
| Northwest Territories |
 |
 |
| Nunavut |
 |
 |
| Canada |
 |
 |
| | |